


Introduction
The aim of this analysis is to review how users behave on Ajna through a type of assessment known as cohort analysis. A cohort analysis allows us to determine whether changes in aggregate metrics come from new users or those who have been using the protocol for a while.
In the charts below, we organize wallets by their `cohort month` where we group those who first interacted with the protocol in the same month. We also refer to `cohort tenure`, which is defined as the number of months since the inception of a particular wallet’s cohort month (1 represents the first month, 2 the second, and so forth). All data is aggregated on the last day of the month, effectively taking a snapshot of pool positions at specific points in time.
The analysis is split between the three main aggregated metrics for the Ajna protocol on Ethereum mainnet, namely:
Total Supply
Total Collateral
Total Debt
On Ajna, Total Value Locked is defined as Total Collateral + Total Supply - Total Debt. Since TVL can be broken down into Collateral, Supply and Debt, we will focus on those three metrics.
TVL and User Growth
Since Ajna’s redeployment, the protocol has witnessed an important growth in the months of January, February, and March, after which the TVL dropped substantially (from 28.5M on 29 February to 7.4M on 31 July, a 74% drop). TVL has slightly rebounded in July, increasing from 6.7M to 7.4M (a 10% increase).
At the same time, the number of new wallets per month has been dropping substantially from January (182) to May, and then stabilized in the months of May, June, and July (17, 17, 16).

Supply Metrics
In Ajna, supply consists of quote tokens supplied. Deposited quote tokens increases the pool’s quote token balance, while also increasing the total sum of deposit across all price buckets.
Absolute Change
The January cohort, after redeployment, supplied 9.3M of quote tokens as supply, which increased to 12.8M in February. Since then, the January cohort has reduced its supply significantly, reaching 4.2M in June and 4.5M in July. The second-largest contributing cohort in July is the February cohort, which started from 5.6M in February and has now stabilized at the 1.3M level.
While supplied amounts have on average decreased throughout the whole period, it is worth noting that the April cohort was the one that increased its supplied amounts, specifically in May when it grew from 1.3M to 1.6M. During July, the February and May cohorts were the ones that increased their supply. Another positive indicator is the fact that in the first tenure month, the Supply has been growing when looking at the July cohort compared to the June one.

Relative Change
The January cohort has also reduced its supply in relative terms, but has always been the top cohort by supply in relative terms, except for July. Here, the February cohort took over as the one contributing the most to supplied amounts. The only two cohorts that have significantly reduced their relative contribution to Supply were the January and March ones, with the other cohorts being relatively stable throughout the analyzed period. It is also interesting to note the growth of relative supply for the July cohort compared to the June one, with June supplying 2.6% of supply in its first tenure month and July debuting at 4.2%.

Tenure and Dominance
The growth percentage per cohort tenure measures the relative change in supply through time compared to the initial amounts supplied. We can see, for example, that the January cohort has been decreasing its supply at an increasing rate, along with the February cohort. For the month of July, we can see that every cohort has reduced their supply compared to their initial supply, however, supply reduction is decelerating over time as we follow the cohorts.

Another important metric is the largest 5 wallets supply dominance, indicating the percentage of supply from the 5 largest wallets in an analyzed cohort. While some variability exists in the January cohort (61% of dominance) the remaining data shows that the other cohorts are mostly driven by the 5 largest wallets of each cohort, in some cases reaching ~100%.

Collateral Metrics
Total collateral is measured by the USD value of tokens used as collateral in Ajna pools. Those serve as collateral for debt positions.
Absolute Change
Compared to the Supply metrics, which experienced a peak in the month of February, total collateral reached its peak in the month of March ($24.2M). The decline started there, to reach the current level of $5M (~80% decrease). In absolute values, the January cohort is still the one contributing the most to total collateral, which in July was equal to $3.1M. The July cohort reported the highest collateral value in the first tenure month since May, interrupting the decreasing trend witnessed since Ajna’s redeployment.

Relative Change
Until May, the relative contribution of the January and February cohorts to total collateral has never dropped below 90%. Even though their relative contribution has now declined (69%), their supplied amounts are still the ones contributing the most to the aggregated collateral. The decrease was mostly driven by the February cohort reducing their relative supply in June and July (22% in May, 8% in July). A positive indicator is the June and July cohorts contributing ~22% to the total collateral, with July debuting at 14.2%.

Tenure and Dominance
All cohorts in July have seen a decrease in collateral compared to the value reported on their first tenure month. While the January cohort especially decreased its collateral value in June and July compared to January, the February and March cohorts witnessed >90% decrease in collateral value. There are two positive indicators, one being the fact that newer cohorts have shown a lower decrease compared to older ones in July, and that during the last two months the collateral decrease remained steady.

Looking at the largest wallets, we can see that the 5 largest wallets dominate most of the collateral. While the January cohort displays a dominance of 77%, the February cohort of 89%, the remaining cohorts show roughly 100% dominance of the 5 largest wallets.

Debt Metrics
Total debt is calculated as the USD value of debt in Ajna pools. By supplying collateral, user can take out loans in form of quote token.
Absolute Change
Even though total collateral reached its peak in March, total debt reached its peak in February ($13.4M), similar to what happened with total supply. Since then, debt has declined to reach the $2.2M level in July. In the last month, total debt has slightly increased (up 16% from $1.9M in June). The July cohort saw the highest initial debt amount since April, with $339k taken as debt. Looking at the July debt values, we can see that $1.1M is still related to the January cohort.

Relative Change
Similarly to total collateral, the January and February cohorts were the main contributors to the relative debt up to May (>90%), which decreased in June (78%) and July (60%). Also in this case, the decline is mostly driven by the February cohort reducing their debt in the months of June and July, with the other cohorts being relatively stable. The July cohort on its first tenure month contributed 16% to total debt. Together, the June and July cohorts together account for roughly 28% of total debt.

Tenure and Dominance
As highlighted in the previous tenure charts, the January and February cohorts especially decreased their debt values in June and July compared to their first tenure month. The February and March cohorts reduced their debt amounts by ~90% compared to their first tenure month, while the remaining cohorts reduced it at a lower rate. We can see also here two positive indicators: newer cohorts showing a lower decrease compared to older ones in July, and steady debt decrease over the last two months.

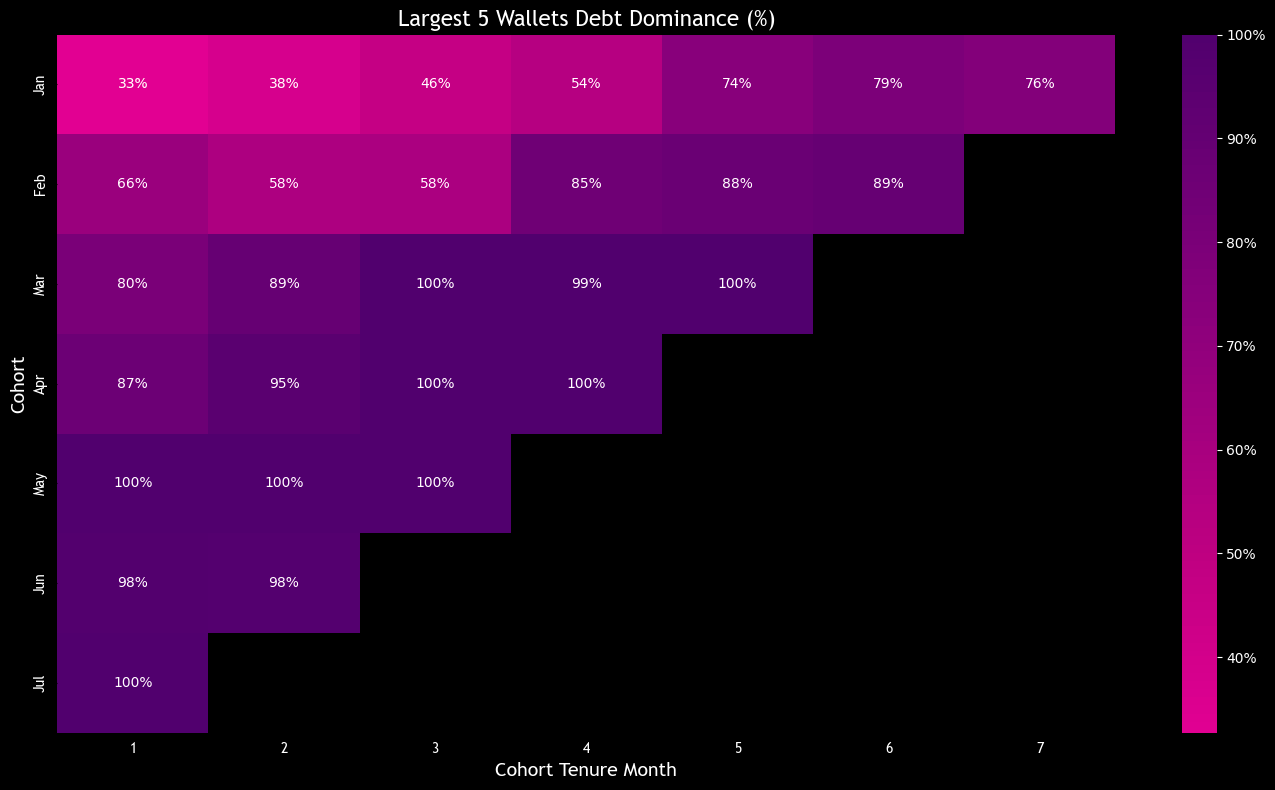
The 5 largest wallets dominate most of the debt for all cohorts, with the January cohort being the most diverse (76% dominance) and the February cohort following suit with 89%. The remaining cohorts show roughly 100% dominance of the 5 largest wallets.
Conclusion
This analysis highlights the main trends in the Ajna protocol since redeployment through the lens of the cohort analysis. By analyzing what users joining the protocol at different stages do, some behavioral conclusions can be drawn.
Most protocol contributions, especially for the newer cohorts, come from the five largest wallets (different wallets for each cohort).
We can see that even though the January cohort has drastically reduced its contribution to the Ajna protocol since the beginning of the year, it is still the one contributing the most to the protocol, indicating that early users are more keen to keep using the protocol.
Another important cohort, the February one, has been decreasing its protocol contributions during the months of June and July, indicating a risk of this cohort further reducing its protocol usage going forward.
In general, we can see that even after the decrease in aggregate protocol metrics since the first months, all cohorts are showing a rebounding behavior during the last two months, where the cohort analysis shows fairly stable metrics.
The analysis highlights another good indicator, namely the July cohort, which has increased its contributions to the Ajna protocol and contributed to the slight growth the protocol witnessed between June and July.